Load Testing with Grafana k6 and InfluxDB
#TESTING #PERFORMANCE

As someone who works for an IT company, you get customer complaints if the application running in production needs to be faster. Maybe it’s because of a new feature, for example, a massive year-end promo feature, so there is a spike in traffic on the service, or it could be a legacy code that has been stable but rarely done maintenance.
Your team intends to transition from this incident by implementing new technology, such as rewriting the legacy code REST API Backend, which previously used Express.js, to Golang Fiber.
After the discussion and planning had matured, the development team began to remodel the backend using Golang. In the middle of the work, the operation team needed clarification about how to test the application.
They need rps (requests per second) data that the new service can handle. This parameter presents and documents legacy service refactoring results to supervisors.
Well, in that case, I found a fascinating tool, namely “Grafana k6” what exactly is this tool?
Grafana k6 is an open-source load testing tool that makes performance testing easy and productive for engineering teams. k6 is free, developer-centric, and extensible.
Using k6, you can test the reliability and performance of your systems and catch performance regressions and problems earlier. k6 will help you to build resilient and performant applications that scale.
k6 is a testing tool created by Grafana Labs developers, which can be used to perform tests such as load-testing or stress testing, and many more. In this article, we will learn together to use these tools, outlined with the following points:
- Learn the basics of k6
- Testing HTTP endpoints with k6
- Visualizing k6 metrics with Grafana Dashboard
There are two ways to use k6: with CLI or scripting using Javascript modules. The command line method is suitable for those who want to try the tools, but the scripting method is highly recommended when applications and acceptance tests are very complex.
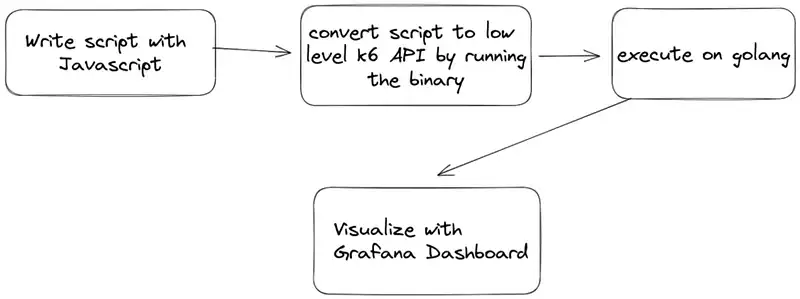
Figure the scripting workflow
To write k6 test scripts, you need to understand the basic syntax of Javascript. But in a nutshell, to follow this article, I’ll ensure you know the basics of Javascript.
- Defining variables, functions
- Logical operators (if-else) and looping (for, while)
- ESM (module import/export)
We will import the k6 module by installing it through the npm registry. But remember, k6 does not run on top of the Node.js runtime because JavaScript is a dynamic language unsuitable for applications requiring intensive computational performance. The role of Javascript here is to compile the script written into a low-level client api k6 made with Golang.
JavaScript is not generally well suited for high performance. To achieve maximum performance, the tool itself is written in Go, embedding a JavaScript runtime allowing for easy test scripting.
K6 Documentation: What k6 does not?
Before we learn to use the command or script k6, we need to install the program. First, you can use the OS package manager or download a binary file. Please read here for more details. In this case, I will use k6 through a Docker container.
# pulling the k6 images
docker pull grafana/k6
I hope you will not be confused about the installation process if you download a single binary. To run the k6 program, you can use the k6command and ensure the program’s location is in the env PATH.
For those who use docker, ensure the Docker Server daemon is running, and run the docker run --rm -i grafana/k6command. The following is the command output if you have installed the tools correctly.
          /\      |‾‾| /‾‾/   /‾‾/
     /\  /  \     |  |/  /   /  /
    /  \/    \    |     (   /   ‾‾\
   /          \   |  |\  \ |  (‾)  |
  / __________ \  |__| \__\ \_____/ .io

Usage:
  k6 [command]

Available Commands:
  archive     Create an archive
  cloud       Run a test on the cloud
  completion  Generate the autocompletion script for the specified shell
  help        Help about any command
  inspect     Inspect a script or archive
  login       Authenticate with a service
  pause       Pause a running test
  resume      Resume a paused test
  run         Start a load test
  scale       Scale a running test
  stats       Show test metrics
  status      Show test status
  version     Show application version

Flags:
  -a, --address string      address for the REST API server (default "localhost:6565")
  -c, --config string       JSON config file (default "/home/k6/.config/loadimpact/k6/config.json")
  -h, --help                help for k6
      --log-format string   log output format
      --log-output string   change the output for k6 logs, possible values are stderr,stdout,none,loki[=host:port],file[=./path.fileformat] (default "stderr")
      --no-color            disable colored output
  -q, --quiet               disable progress updates
  -v, --verbose             enable verbose logging

Use "k6 [command] --help" for more information about a command.
After successfully running the command, please follow the instructions below to write the k6 load-testing script. Create a new workspace, then create a new file called script.js and copy the following code:
import http from 'k6/http';
import { sleep } from 'k6';

export default function () {
  http.get('https://test.k6.io');
  sleep(1);
}
Then run the scripts. Remember, we won’t be using Node.js or any other javascript runtime!
# single binary
k6 run --vus 10 --duration 5s script.js

# via docker container
docker run --rm -i grafana/k6 run --vus 10 --duration 5s - <script.js
Output:
          /\      |‾‾| /‾‾/   /‾‾/
     /\  /  \     |  |/  /   /  /
    /  \/    \    |     (   /   ‾‾\
   /          \   |  |\  \ |  (‾)  |
  / __________ \  |__| \__\ \_____/ .io

  execution: local
     script: script.js
     output: -

  scenarios: (100.00%) 1 scenario, 10 max VUs, 35s max duration (incl. graceful stop):
           * default: 10 looping VUs for 5s (gracefulStop: 30s)


running (06.5s), 00/10 VUs, 40 complete and 0 interrupted iterations
default ✓ [======================================] 10 VUs  5s

     data_received..................: 515 kB 79 kB/s
     data_sent......................: 7.3 kB 1.1 kB/s
     http_req_blocked...............: avg=175.77ms min=4.01µs   med=15.02µs  max=715.58ms p(90)=706.57ms p(95)=710.78ms
     http_req_connecting............: avg=85.28ms  min=0s       med=0s       max=342.73ms p(90)=341.58ms p(95)=342.13ms
     http_req_duration..............: avg=364.05ms min=284.2ms  med=305.44ms max=625.6ms  p(90)=597.87ms p(95)=606.41ms
       { expected_response:true }...: avg=364.05ms min=284.2ms  med=305.44ms max=625.6ms  p(90)=597.87ms p(95)=606.41ms
     http_req_failed................: 0.00%  ✓ 0        ✗ 40
     http_req_receiving.............: avg=52.64ms  min=45.2µs   med=354.77µs max=311.96ms p(90)=289.79ms p(95)=299.06ms
     http_req_sending...............: avg=73.66µs  min=17.71µs  med=73.16µs  max=147.98µs p(90)=123.85µs p(95)=137.6µs
     http_req_tls_handshaking.......: avg=80.67ms  min=0s       med=0s       max=334.8ms  p(90)=325.29ms p(95)=329.16ms
     http_req_waiting...............: avg=311.33ms min=283.49ms med=303.25ms max=601.42ms p(90)=320.41ms p(95)=321.97ms
     http_reqs......................: 40     6.154771/s
     iteration_duration.............: avg=1.54s    min=1.3s     med=1.32s    max=2.03s    p(90)=1.99s    p(95)=1.99s
     iterations.....................: 40     6.154771/s
     vus............................: 6      min=6      max=10
     vus_max........................: 10     min=10     max=10
Explanation of the command above:
- We simulated a load test on the endpoint https://test.k6.io
- Within 5 seconds
- With 10 VUs (virtual users)
A virtual user is a temporary loop that requests an endpoint, so we created ten temporary loops simultaneously in the command.
Each VU executes an exact number of iterations. The total number of completed iterations will be = vus * iterations
From the output, k6 provides several variables we will extract later to visualize metrics through Grafana Dashboard.
Next, we will export the metric data from k6 to the Grafana Dashboard; for the database used to store these metrics, we will use InfluxDB. Copy the following configuration to create the three services (k6, Grafana Dashboard, and InfluxDB) and save the file as docker-compose.yaml.
version: '3.4'

services:
  influxdb:
    image: influxdb:1.8
    networks:
      - k6
      - grafana
    ports:
      - '8086:8086'
    environment:
      - INFLUXDB_DB=k6

  grafana:
    image: grafana/grafana:latest
    networks:
      - grafana
    ports:
      - '3000:3000'
    environment:
      - GF_AUTH_ANONYMOUS_ORG_ROLE=Admin
      - GF_AUTH_ANONYMOUS_ENABLED=true
      - GF_AUTH_BASIC_ENABLED=false
    volumes:
      - ./grafana:/etc/grafana/provisioning/

  k6:
    image: grafana/k6:latest
    networks:
      - k6
    ports:
      - '6565:6565'
    environment:
      - K6_OUT=influxdb=http://influxdb:8086/k6
    volumes:
      - ./scripts:/scripts

networks:
  k6:
    driver: bridge
  grafana:
    driver: bridge
Before running the docker-compose configuration, please create a scripts/ directory equivalent to the docker-compose.yaml path.
├── docker-compose.yaml
└── scripts
    └── script.js
Run the Docker Compose service on the background task.
docker-compose up -d
Output:
Starting labk6_k6_1       ... done
Starting labk6_influxdb_1 ... done
Starting labk6_grafana_1  ... done
Add a data source (InfluxDB) with the following configuration, and leave the configuration as default.
Name: InfluxDB K6
HTTP > URL: http://influxdb:8086
InfluxDB Details > Database > k6
default login Grafana Dashboard
user: admin password: admin
login to Grafana Dashboard at http://localhost:3000
If the data source configuration is successful, the following text will appear after you perform the “Save and test” action. data source is working. 0 measurements found.

Grafana Dashboard add data source (influxdb)
After successfully adding the data source, we will create a dashboard to visualize the metrics from k6. We will use the preconfigured dashboard in the marketplace to make it easier and more enjoyable.
Select Dashboard menu > New > Import
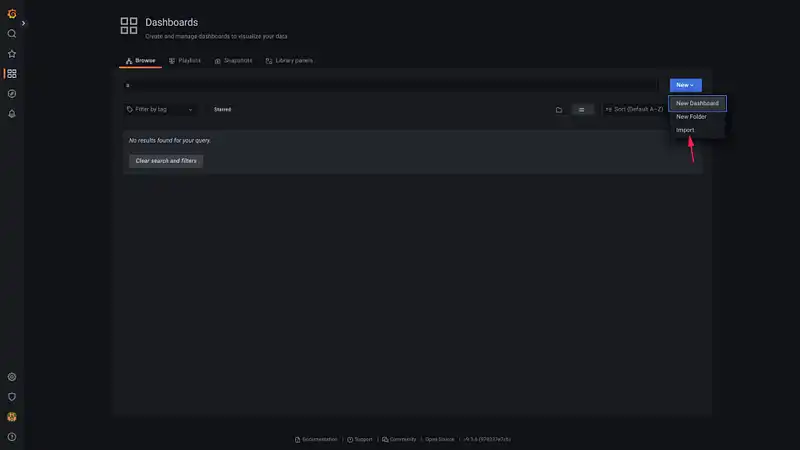
Figure: Importing the marketplace library for visualizing metric data
Enter the dashboard id value 2587in the “Import via grafana.com” section, adjust the data source we added earlier, “InfluxDB K6”, and select the import action.

Figure: Data imported succesfully
After the data source is successfully added and the dashboard from the marketplace is successfully imported, it’s time for us to process the metric data from the k6 result and then check the response from the backend services through the Grafana Dashboard. Edit the scripts/script.js file. The filter with the script below will aim to retrieve dummy data from the fake REST json server.
import http from 'k6/http';
Run the script with the following command:
docker-compose run -v $PWD/scripts:/scripts k6 run /scripts/script.js
The docker-compose command mounts the scripts/ directory to the k6 container and runs the k6 binary program that executes scripts/script.js on the remote container.
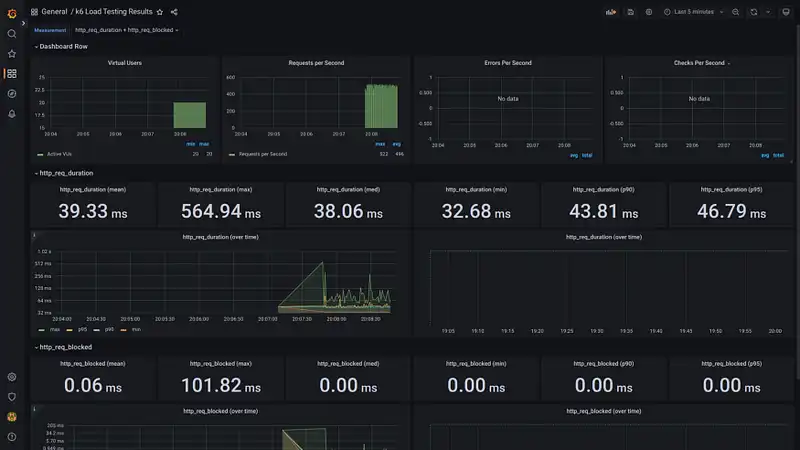
Figure: Get the metric visualized data report
What’s next? Try testing on an HTTP REST endpoint that accepts the POST method by sending data via form-data or json. Also, don’t forget to read the official k6 documentation to get the Javascript module API documentation.
If you have trouble getting the autocomplete feature in the script, you can install the @types/k6 module or extensions in your favorite code editor/IDE.